> For the complete documentation index, see [llms.txt](https://spacecore.gitbook.io/wiki/llms.txt). Markdown versions of documentation pages are available by appending `.md` to page URLs; this page is available as [Markdown](https://spacecore.gitbook.io/wiki/en/system-monitoring/traceroute-mtr.md).
# How to use the MTR tool
{% hint style="danger" %}
### This content is outdated
**The knowledge base has moved →** [**https://wiki.spacecore.pro/**](https://wiki.spacecore.pro/)
This wiki is no longer updated. All current guides and articles are at the new address.
{% endhint %}
{% content-ref url="" %}
{% endcontent-ref %}
***
Tracing is most often useful in diagnosing various problems related to the operation of a network.
## Linux \[Traceroute]
First you should install this utility if it is not on your server:
```
apt install mtr
```
**For CentOS**:
```
yum install mtr
```
{% hint style="info" %}
Utility command usage structure:
**mtr «arguments» «ip»**
{% endhint %}
{% hint style="info" %}
List of valid arguments:
* **-h** — short reference.
* **-v** — utility version output.
* **--udp** — use **UDP** packets instead of standard **ICMP**.
* **--tcp** — use **TCP** packets instead of standard **ICMP**.
* **-4** — **IPv4** protocol usage.
* **-6** — **IPv6** protocol usage.
* **-с** — the number of packets to be sent.
* **-r** — Collect the trace in the background and display the report when it is complete.
* **-w** — performs the same function as `-r` , but in a more complete format.
* **-s** — specify the size of the packets to send.
* **-f** — entering the initial **TTL** value.
* **-e** — mpls data display.
* **-n** — do not use domain names for host names (only IP addresses will be used).
* **-o** — displaying only specific data categories.
* **-p** — output data in line format.
* **-l** — display information in a non-formalized form.
* **-a** — Specify the address of the interface from which packets will be sent during tracing.
{% endhint %}
Try to make a trace in the standard way:
For example, if you want to trace 7 TCP packets to the `wiki.spacecore.pro` host and get information about the nodes in the format of IP addresses, you can use this command:
```
mtr --tcp -c 7 -n wiki.spacecore.pro
```
The result will be:
## Windows \[WinMTR]
We are installing the **WinMTR** utility. It is available at the [link](https://mirror.spacecore.info/uploads/winmtr-v092.zip). We run the version of the program depending on the bit of your operating system.
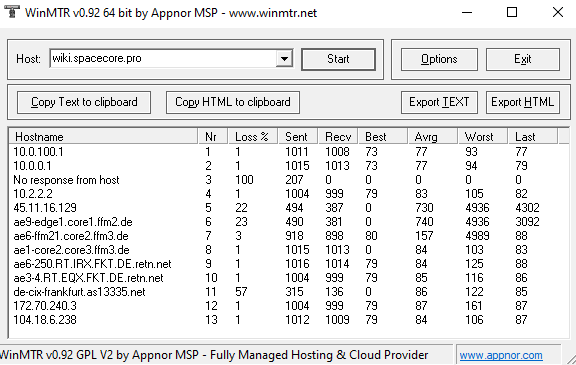
In the **Host** field, specify the destination server to which you want to build the trace. Then click the **Start** button.
We wait until at least 1000 packages have been sent. Usually this time is sufficient.
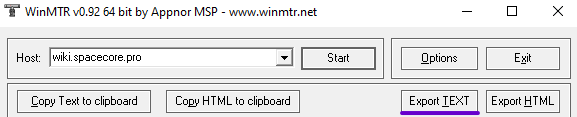
To export the trace result as a text document, use the **Export TEXT** button and save the file.
If you have collected a trace to diagnose any problem as requested by the technical support officer in the ticket, please, in addition to tracing, do not forget to attach the address from which the trace was made.